Conjure CloudWatch metrics in the CLI!
Visualizing CloudWatch Metrics in the command line using Node.js!
Intro
awscii allows for the ability to stay in the command line when troubleshooting or the desire to retrive AWS CloudWatch Metrics. This open-source tool displays your accounts CloudWatch metrics in an easy to digest, updatable way!
Capabilities
The following AWS services and related metrics are supported for awscii visualization. This is not a fully inclusive list of all monitored CloudWatch Metrics.
AWS Lambda
- Invocations
- Duration
- Errors
- Error count and success rate
- Concurrent executions
Amazon DynamoDB
- Read Capacity
- Write Capacity
- Throttled read events
Amazon API Gateway
- Count
- Latency
- 4XXError, 5XXXError
Requirements
- Node.JS 12 or later
- An AWS account
- IAM permissions, granted via the AWS credentials to execute CloudWatch Metrics
- Granular policy IAM policy shown below
 1  {
 2  "Version": "2012-10-17",
 3  "Statement":[{
 4      "Effect":"Allow",
 5      "Action":["cloudwatch:GetMetricStatistics","cloudwatch:ListMetrics"],
 6      "Resource":"*",
 7      "Condition":{
 8         "Bool":{
 9            "aws:SecureTransport":"true"
10            }
11         }
12      }
13   ]
14}
json
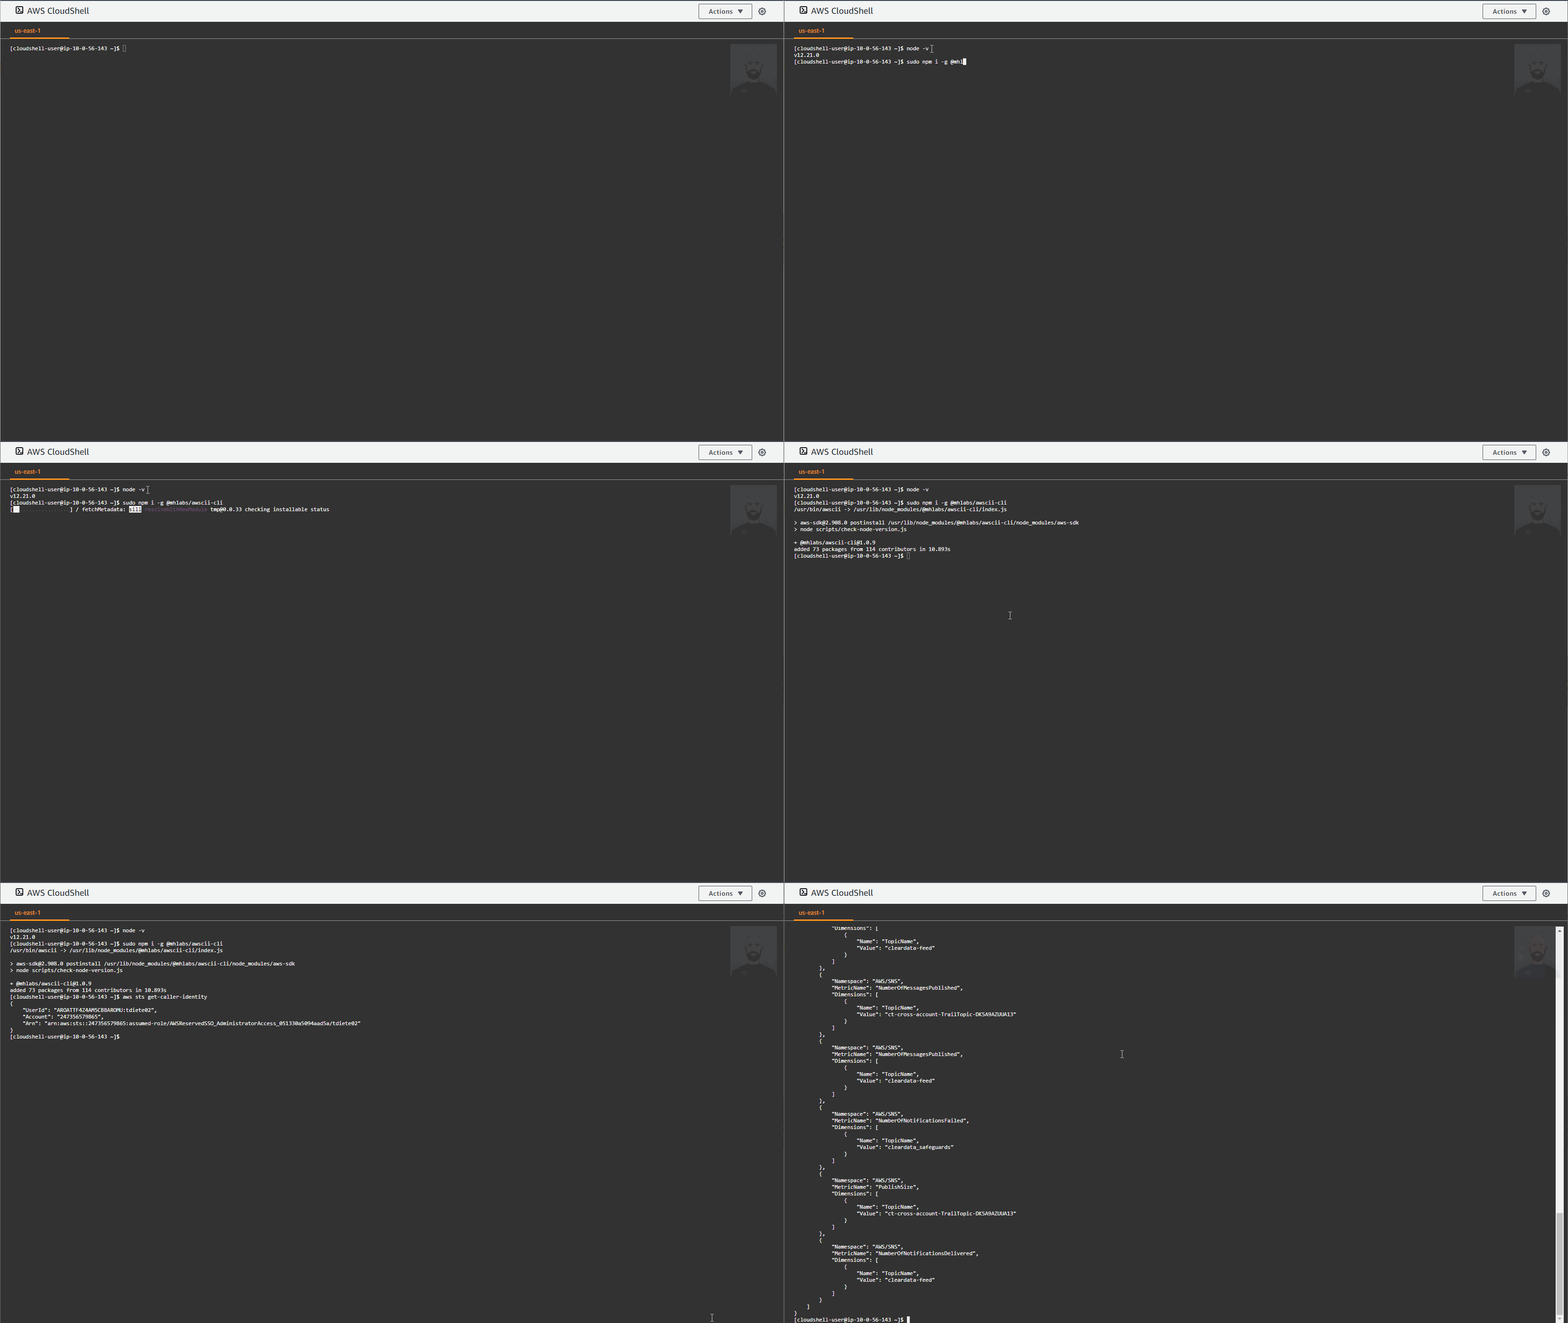
Now, let’s see it in action!
Setup & Installation

First walkthrough

Using the Linux watch command paired with awscii


Thanks for reading! awscii is available for download on npm!